← All workREPLICAHead of Design · Aug 2020 – Aug 2024
Analytics workflow · Redesign · 2020 – 2024
Complex mobility data, made approachable.
The Places Study feature transforms raw mobility data into clear, actionable insights for urban planners, policymakers, and researchers. It provides a granular view of daily life for residents, visitors, and commercial vehicles nationwide, through a redesigned interface that makes complexity approachable.
Places Study: maps, charts and the dataset view working together.
Summary · 2 minutes
The short version.
3xgrowth in active users within 12 months
Weeklyprototype iterations with internal teams and pilot users
The problem
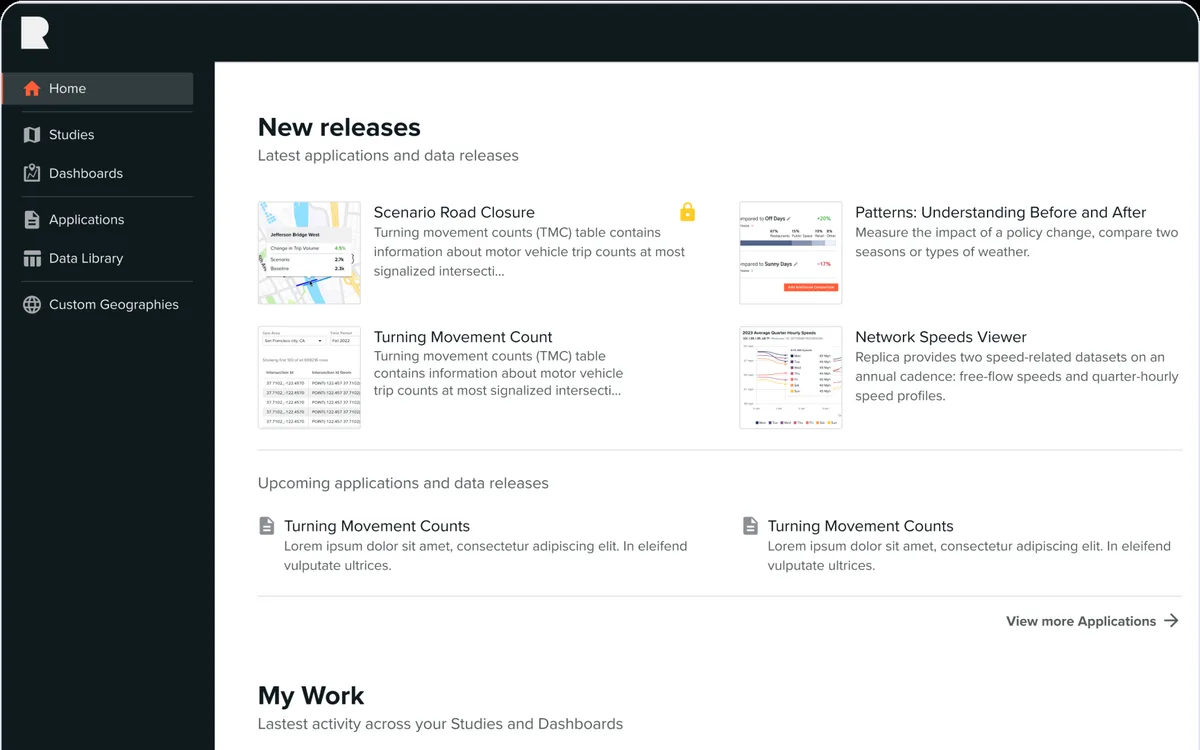
The original Study feature was a quickly built MVP created by developers during the pandemic. It worked, but the experience was clunky, inconsistent, and lacked design vision. Users could see the potential but struggled to navigate the data or connect maps, tables, and filters in a meaningful way.
The approach
1Unify maps and tablesLow-fidelity sketches explored ways of unifying maps and tables, streamlining filtering and improving hierarchy.
2Iterate weeklyClickable Figma prototypes tested with internal teams and pilot users, with weekly iterations.
3Build it as a systemPatterns introduced in Places Study were built to be reused across other features.
What we did
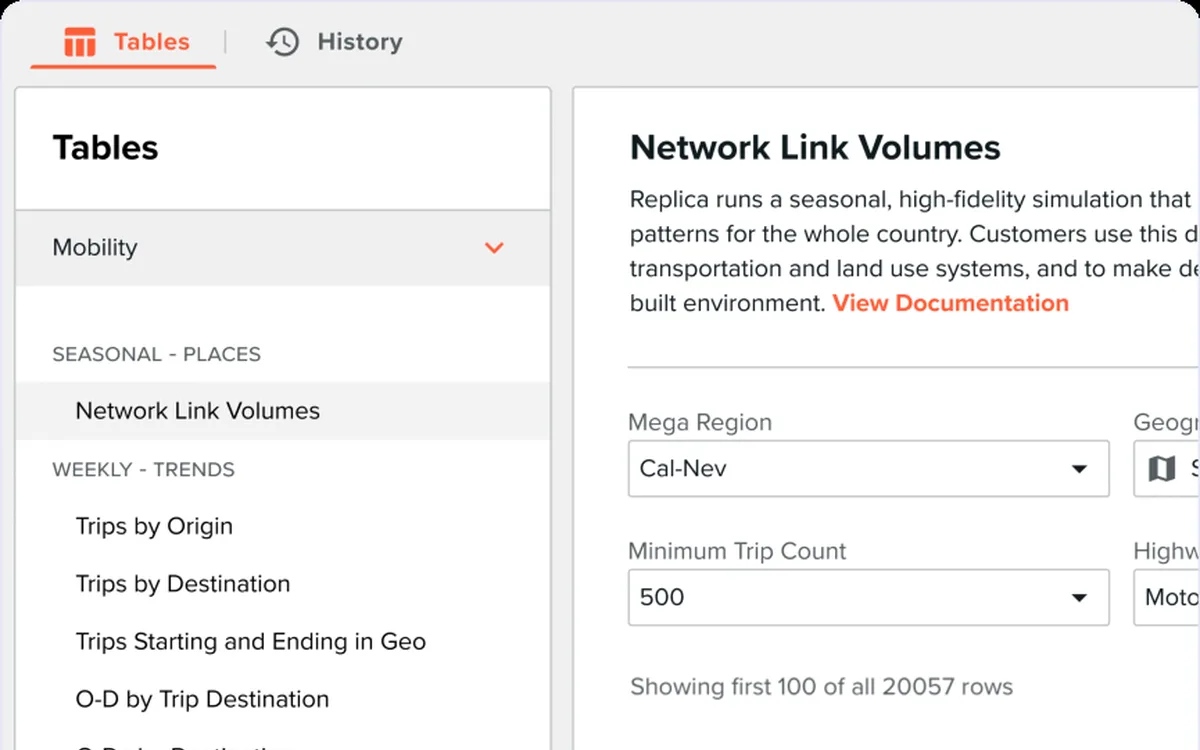
01Direct dataset accessOne-click download of disaggregated data for deeper analysis.
02Scalable filteringFilters that work across both map and table views, handling multiple attributes.
03Integrated geospatial analysisMaps, charts and filters that respond to each other.
04Cohesive information architectureMaps, charts, and filters work together in a connected layout.
The full story
6 chapters.
01Research and insights
Three barriers.
Through interviews, surveys, and support feedback, three key barriers emerged.
Data access was too abstractEven advanced users struggled to reach raw datasets.
Filtering lacked flexibilityUsers wanted both tabular and geospatial controls that could scale.
The experience felt fragmentedMaps, charts, and filters did not feel connected.
Pain points mapped onto the original Study interface.Study profiles: who needs raw data and who needs guided visuals.
02Early concepts
Sketching and system flows.
Low-fidelity sketches explored ways of unifying maps and tables, streamlining filtering workflows, and improving information hierarchy. System-level flow diagrams mapped every user step from defining datasets to visualizing results.
Early sketchesInformation architectureInteraction modelWireframes
03Prototyping and iteration
Weekly loops with pilot users.
Clickable prototypes were built in Figma and tested with internal teams and pilot users. Feedback loops were fast and collaborative, with weekly iterations informed by qualitative insights and technical feasibility checks.
A clickable Figma prototype used with pilot users.
04Systematizing the UI
Patterns built to be reused.
A scalable design system was created for Replica, ensuring patterns introduced in Places Study could be reused across other features.
Map layer and interaction patterns from the Study design system.
05Key improvements
Maps, charts and filters that work together.
Direct dataset accessOne-click download of disaggregated data for deeper analysis.
Scalable filteringFilters that worked seamlessly across both map and table views, handling multiple attributes.
Integrated geospatial analysisCharts and maps filter each other in the same panel.
Cohesive information architectureMaps, charts, and filters work together in a connected layout.
Study explorerAdding a filterFiltering from a chartDataset view
06Impact
What made this work.
3x growth in active users within 12 months
Contributed to Replica surpassing revenue targets and moving toward profitability
Became a go-to tool for urban planning, transportation, housing, and public safety initiatives
The success of Places Study came from balancing system-level design thinking with practical iteration. The result was a tool powerful enough for advanced analysts yet approachable for newer users, making complex datasets easier to explore, analyze, and act on.
Looking back
What I learned.
LESSON 1Balance system thinking with iterationThe success of Places Study came from balancing system-level design thinking with practical iteration: powerful enough for advanced analysts, approachable for newer users.
What’s next
A go-to tool for urban planning, transportation, housing, and public safety initiatives.