← All workREPLICAHead of Design · Aug 2020 – Aug 2024
Data visualization · COVID-19 response · Aug – Oct 2020
Weekly insight during a crisis.
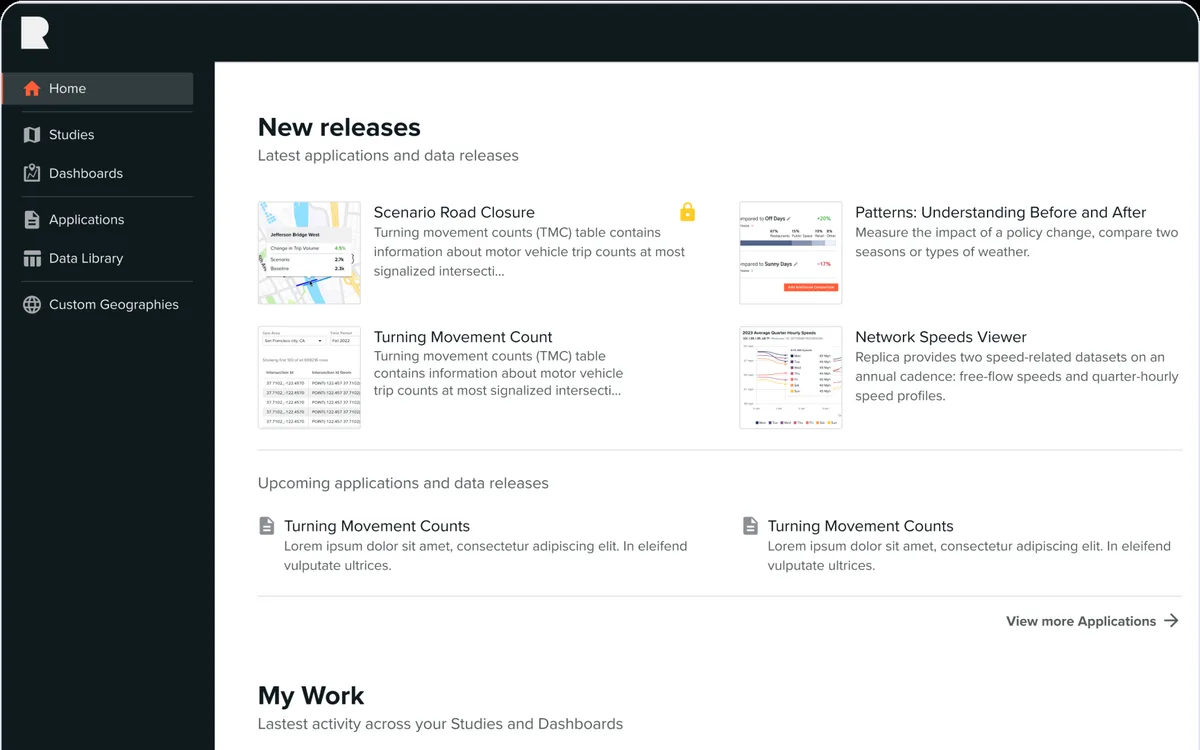
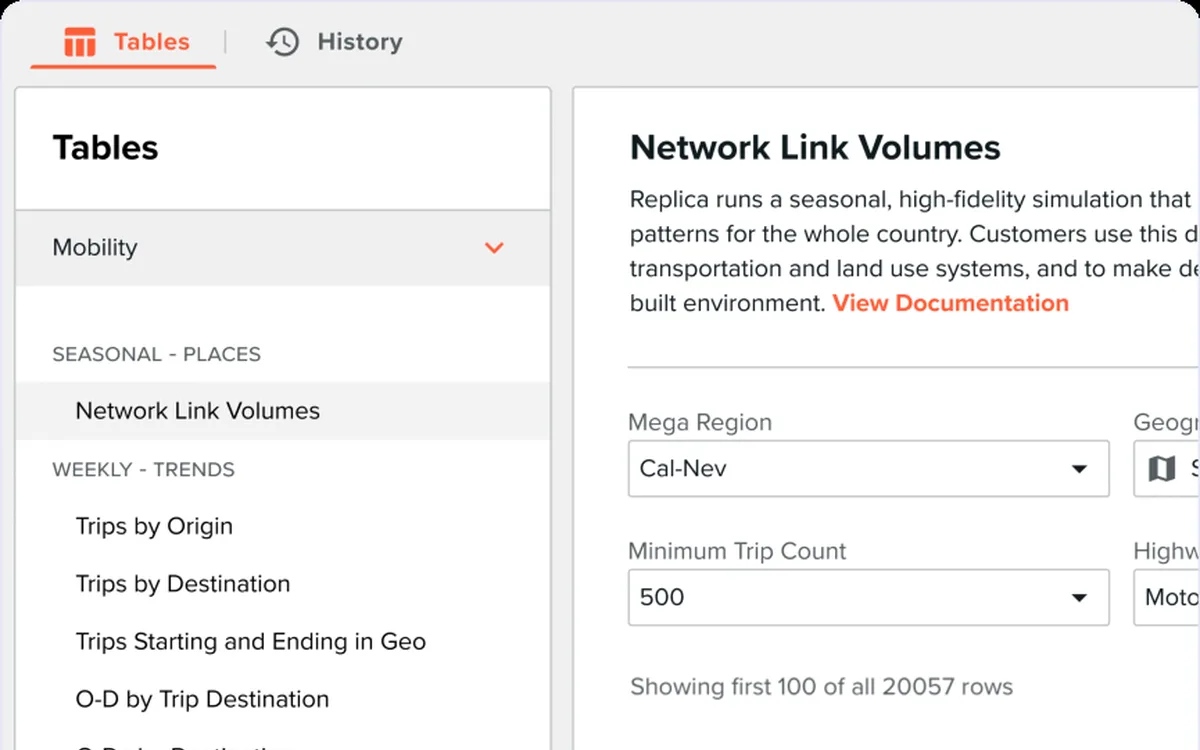
Trends provides close to real-time insight into mobility, economic activity, and land use. At the height of COVID-19, it gave users a comprehensive view of evolving trends through an intuitive interface, supporting decisions about community status and public policy.
Trends: weekly mobility and spending patterns, nationwide.
Summary · 2 minutes
The short version.
2 mofrom August 2020 redesign start to October 2020 beta
NYstate contract renewed, worth multiple millions
The problem
A feature conceived as an MVP and hastily deployed amid the pandemic. Built mainly by developers without a dedicated product design and management team, the interface was functional but unrefined.
The approach
1Focus on core requirementsA basic framework of product requirements, fast.
2Standards for charts and mapsA data-science-backed style guide for clarity and consistency.
3Learn after betaUser feedback sessions drove rapid iteration after release.
What we did
01Revamped UXDesigned, prototyped, and tested a new UI.
02Visualization standardsA style guide for charts and maps.
03Event trackingMark dates or periods of interest on charts.
04Time optionsWeekly and monthly ranges, latest or custom.
The full story
4 chapters.
01Initial plan
An MVP, deployed in a crisis.
Joining Replica in August 2020, I was greeted by a feature conceived as an MVP and hastily deployed to users amidst the unfolding pandemic. The development, primarily driven by developers in the absence of a dedicated product design and management team, resulted in a functional yet unrefined user interface.
Recognizing the potential impact of this tool, especially in providing critical insights during the pandemic, my task was to transform this MVP into a fully realized, user-centric feature. This required not just a redesign of the interface but a reevaluation of the dashboard’s role within the broader context of Replica’s offerings and the urgent needs of our users during an unprecedented global crisis.
02User research
Proxies first, then real sessions.
With a clear signal on what data Replica needed to provide, I initially worked with PMs and our Customer Success Team as proxies for our users to develop a set of requirements and designs and data science backed visualization standards. Once a beta version was released, I helped run user feedback sessions to inform rapid development and deployment of subsequent iterations.
Rapid focus on core requirementsEnhanced user experience by leveraging a basic framework of product requirements.
Revamping user experienceDesigned, prototyped, and tested a new UI that aligned with user expectations and needs.
Data visualization standardsDeveloped a comprehensive style guide for charts and maps to ensure clarity and consistency.
Event trackingIntroduced event tracking to mark dates or periods of interest on charts.
Mobility metricsSpend metricsIn-person retail spend, mappedCreating an eventTime options
04Results
Contracts renewed on the strength of the data.
The Trends Dashboard met the requirements to renew and secure a multi-million dollar contract with the state of New York. Subsequent large-value contracts and renewals followed due to demand for access to Trends data, thanks to its intuitive presentation and controls.
Looking back
What it led to.
What’s next
Subsequent large-value contracts and renewals followed, driven by demand for Trends data and its intuitive presentation.